The food chain has a coordination problem, not a technology problem.
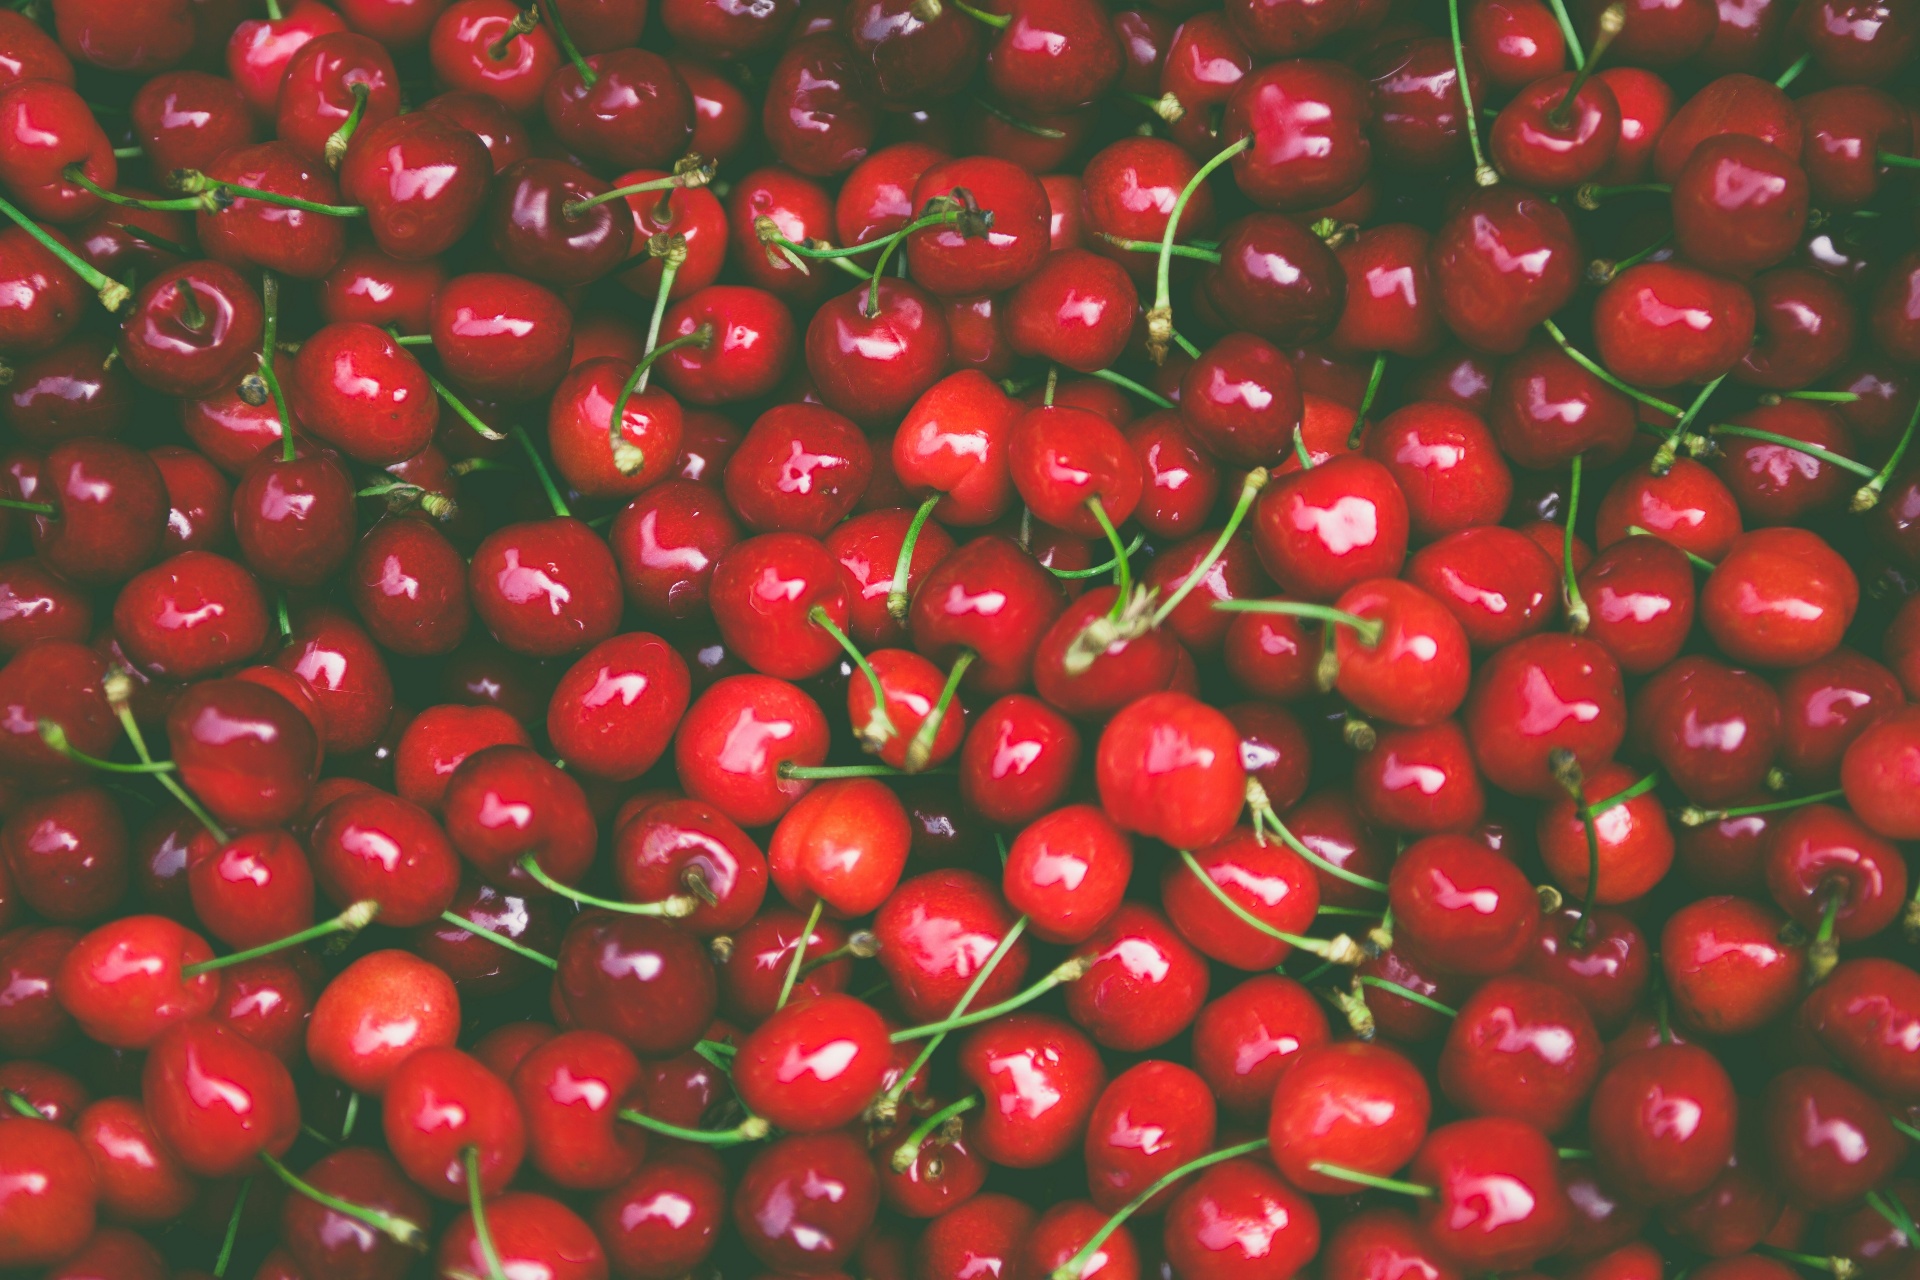
Walk any fresh produce chain and you will find surplus everywhere. A pallet of fruit graded out for the wrong size. Pumpkin seeds worth more as cosmetic oil than the pumpkin was worth as a vegetable. The value is real, and often higher than the crop it came from. Most of it still leaves the chain as a cost.
There is no shortage of valorisation technology — presses, sorters, anti-waste apps, extraction patents, processing ventures. The blocker sits earlier than any of them. A grower cannot capture a residual stream alone. A processor cannot create demand alone. A buyer cannot fix collection logistics alone. Surplus is a coordination problem wearing a technology costume.
The supply chain
Food value loop
Outer ring: the fresh-food value chain. Purple: virgin inputs in. Inner arcs: valorisation loops, coloured by value retained. Red: surplus leaving the chain as cost when no one has agreed who carries it.
R-ladder · value kept in the loop
- R0–R2Smarter use & design cuts virgin inflowRefuse, rethink, reduce
- R3–R7Extend lifespanReuse, repair, refurbish, repurpose
- R8RecycleMechanical & chemical recycling
- R9Recover energyEnergy recovery
Reserved channels · never used on the ladder
- virginVirgin inputVirgin inputs: land, water, fertiliser, energy
- leakageLeakageLandfill, incineration & emissions
- chainThe chainPrimary value chain path
The problem from where you sit
CEO, owner or buying director
The cheapest disposal route is closing, and the value is sitting in the surplus.
Disposal has been the silent line item that made the rest of the model work. The revised Waste Framework Directive now sets binding food-waste reduction targets, and the cheap exit will keep getting more expensive. The surplus inside your chain is often worth more than the produce it came from — pumpkin seed oil for cosmetics is the classic case — but capturing that value needs a buying commitment, not a new machine. The question for you is whether your buyers, your growers and your finance partners are sitting at the same table early enough to agree who carries the cost of moving a residual stream and who commits to the offtake.
Sourcing, sustainability or operations manager
Three decisions that used to sit in different lanes are now one decision.
Specification, logistics and disposal used to be three separate budgets owned by three different people. With binding targets, fee-modulated EPR-style schemes appearing for food and a tightening of cheap export routes, those three are now one decision per residual stream. The blend of out-grades you accept decides whether a valorisation route is bankable. The collection frequency you agree decides whether the clock runs out before value can be captured. The recycled-content or recovered-ingredient claim your buyer wants only stands up if the chain behind it has actually agreed who pays for what.
Field, packhouse or canteen floor
The waste you see every shift is about to have a price tag.
You are the one who sees the pallet graded out, the over-order in the cool store, the trays heading back from the canteen barely touched. For years those were quiet inefficiencies that never reached a report. Under the new targets and the new buyer demands, each one becomes measurable cost and measurable reduction. What you notice is only worth anything if it reaches the people setting the specification, the order volumes and the buying contracts — early enough that the product can still change.
CRL2 without CRL1 — the kit works, the chain was never agreed
The common failure runs like this: a venture buys the press, builds the app, or secures the patent, then waits for the value to arrive. That is movement at CRL2 (certification and compliance) or CRL3 (a single party adopting a technology) before CRL1, where the chain agrees what the surplus is worth and who carries it. The kit works. The chain around it was never agreed, so the value still leaks. Switching to a recycled fibre, an anti-waste app or a valorisation patent does not, on its own, make a food chain circular — it leaves the coordination problem in place under a new label.
The rules behind it, and when they bite
The regulatory pressure on food waste lands in the revised Waste Framework Directive, which entered into force on 16 October 2025. For the first time it sets binding national food-waste reduction targets — measured against a 2021 to 2023 baseline and due by 31 December 2030. The targets press hardest on processing, retail, food services and households. A Commission review due by the end of 2027 may extend them upstream toward primary production, where most value currently leaks before it ever reaches a buyer.
16 Oct 2025
Waste Framework Directive
Revised Waste Framework Directive enters into force, binding food-waste targets adopted
In force2027
Waste Framework Directive
Commission review of food-waste targets, possible extension toward primary production
Upcoming31 Dec 2030
Waste Framework Directive
10% cut in processing and manufacturing; 30% per capita across retail, food services and households
Upcoming
The pressure to cut food waste is now regulatory, not voluntary. Disposing of a surplus more efficiently meets a target on paper. Capturing the value inside it needs the chain to coordinate first — and that is the step most food projects skip.
Four pressures turn surplus into cost
Each pressure is survivable on its own. Together they make disposal the cheapest option, even when the surplus is worth more than the produce it came from. The value does not disappear — it leaves the chain as a cost, and someone in the chain pays to be rid of it.
Four pressures, one cost
Surplus appears and four pressures bear down at once. The gap between what the chain can absorb and what it would need to coordinate is where value leaves as cost.
Pressures arriving on the surplus
The clock
Value decays from harvest. A residual stream has hours, not seasons.
The volumes
Surplus shows up in small, irregular lots across many growers. No single lot is big enough to justify its own logistics.
The margin
Fresh produce runs on cents per kilo. There is no slack to fund a separate collection and processing route.
The buyer
Buyers commit to specification produce. Few commit to a stream that changes week to week.
What the chain would need to absorb it
Shared logistics
Pooled collection across growers so the cost falls and a residual stream can compete on price.
Shared data
Shelf-life prediction and stream visibility that only work on data the chain agrees to share.
Offtake commitment
A buyer ready to take what the surplus becomes, on a contract that makes the route bankable.
The chain pays the cost
Disposal is the cheapest option only because the coordination cost was never agreed. Someone in the chain pays to be rid of value the chain itself created.
Surplus is not a technology problem. It is a coordination problem, and CRL1 — the shared agreement on what the surplus is worth and who carries it — is the step most food projects skip.
How circular each market really is
Geography is the heading. The circularity figure sits beneath it as a sourced indicator. The metric name distinguishes the economy-wide Eurostat rates from the global Circularity Gap figure, so the number is never mistaken for a food-specific recycling rate.
European Union
12.2% circular material use, Eurostat 2024
The EU has, for the first time, made food-waste reduction a binding obligation rather than a voluntary goal, and the targets reach across processing, retail, food services and households.
- Revised Waste Framework Directive in force since 16 October 2025: first binding national food-waste reduction targets
- 10% cut in processing and manufacturing by 31 December 2030, against a 2021 to 2023 baseline
- 30% per capita cut across retail, restaurants, food services and households by 31 December 2030
- Commission review due by end 2027, with possible extension of targets toward primary production
- Pressure points: processing and consumer end first, primary production still largely outside the binding scope
International
6.9% global circularity, Circularity Gap Report 2026
Globally the direction of travel is set by the UN Sustainable Development Goal 12.3 commitment and a growing patchwork of national food-waste laws.
- SDG 12.3: halve per capita global food waste at retail and consumer level by 2030, reduce food losses along production and supply chains
- France: 2016 law banning supermarkets from destroying unsold edible food, requiring redistribution agreements
- United States: voluntary 2030 Food Loss and Waste Reduction Goal, state-level organics bans in California, Vermont and others
- Direction of travel: food-waste rules are tightening rather than relaxing, with the EU framework becoming the practical benchmark
Netherlands
32.7% circular material use, Eurostat 2024
The Netherlands has the EU's highest circular material use rate and is actively running chain-level coordination work in agrifood and regional food-waste initiatives.
- Stichting Samen Tegen Voedselverspilling: national platform coordinating producers, retailers, foodservice and government against the 50% reduction goal
- Regional circular coordination: active pilots across regional hubs bringing together growers, logistics, and buyers to build circular business cases for residual crops
- Buyers and finance at the table: major banks and foodservice organizations working on demand commitments for valorised surplus streams
- Open question: whether high-value valorisation routes (cosmetics-grade oils, ingredient extraction) can be financed and contracted fast enough to compete with disposal
Ireland
2.0% circular material use, Eurostat 2024
Ireland has one of the EU's lowest circular material use rates and comes at food waste with strong agri-food exports and a still-developing surplus-redistribution and valorisation infrastructure.
- National Food Waste Prevention Roadmap: aligning national policy with the EU binding 2030 targets
- EPA annual food-waste statistics: around 750,000 tonnes of food waste generated per year, of which roughly a third is from households
- FoodCloud and partners: established surplus-redistribution network linking retailers and foodservice to charities, a base the new targets are designed to scale rather than disrupt
- Pressure points: a strong primary-production sector still largely outside the binding scope, and a processing sector facing the 10% reduction target by 2030
Where does this leave you?
Five statements about the residual streams in your chain. Count the ones you can honestly say yes to. The gaps are where the value is leaking, and where to start.
- 1. We know which residual streams in our chain are worth more than the produce they come from, and by how much.
- 2. We have agreed, at chain level, who carries the cost of moving each residual stream and who commits to buying what it becomes.
- 3. We share enough data across the chain (shelf life, volumes, timings) for valorisation routes to be planned, not improvised.
- 4. We have offtake commitments from buyers or finance partners that make a valorisation route bankable.
- 5. We are tracking our exposure to the 2030 binding food-waste targets and can show progress against a 2021 to 2023 baseline.
Answer all five statements to see your readout.
What CRL1 looks like in food — chain-level coordination
Consider a regional fruit and vegetable supply chain. When graded-out produce or processing by-products are treated as individual farm-gate problems, they remain waste. A coordinated approach brings growers, logistics providers, and commercial off-takers (such as food processors, cosmetic manufacturers, and animal feed producers) together to agree on solutions. The core condition of CRL1 is shared understanding: the parties first map the real volume, timing, and quality of the streams, and explicitly agree on who covers the cost of handling and transport, and who commits to purchasing the resulting product. For example, by pooling logistics, growers can reach the volume threshold required for viable industrial processing. High-value cosmetics-grade oil can be extracted from pumpkin or fruit seeds if cosmetic brands commit to bulk demand upfront. None of this relies on new machinery; it relies on building and holding chain-level agreements.
This represents a generic chain-level coordination structure. Adjust parameters to reflect your specific agricultural or manufacturing context.